
SPSS for Beginners: Running Your First Regression Analysis
If you are staring at SPSS for the first time with a dissertation deadline looming, you are not alone. Every year thousands of UK students reach the data analysis chapter of their dissertation and realise that nobody actually taught them how to use the statistics software their supervisor keeps mentioning. Regression analysis in particular has a reputation for being intimidating, mostly because the word sounds more complicated than the actual process.
This guide walks through your first regression analysis in SPSS from start to finish. No jargon dumps, no assuming you already know what a coefficient is. Just a practical explanation of what regression does, how to run it, and how to read the output without panicking.
What Regression Actually Tells You
Before opening SPSS, it helps to understand what you are trying to find out. Regression analysis measures the relationship between one thing you are trying to explain (your dependent variable) and one or more things you think might explain it (your independent variables).
Say you are researching whether study hours predict exam scores. Exam score is your dependent variable, the outcome you care about. Study hours is your independent variable, the thing you think has an effect. Regression tells you whether that relationship is real, how strong it is, and how much of the variation in exam scores can actually be put down to study hours rather than chance.
There are two common types you will run into as a beginner. Simple linear regression looks at one independent variable and one dependent variable. Multiple regression looks at several independent variables at once, for example study hours, attendance, and sleep, all predicting exam score together. Most dissertations end up using multiple regression because real life rarely has just one cause for anything.
Getting Your Data Ready
SPSS is unforgiving about messy data, so a bit of housekeeping before you touch the Analyze menu will save you hours of confusion later.
Open your data file and check the Variable View tab at the bottom of the screen. This is where you tell SPSS what each column actually represents. Make sure your dependent and independent variables are set to Scale if they are continuous numbers like scores, ages, or hours. Categorical variables like gender or year group should be set to Nominal.
Check for missing values. A few blank cells scattered through a dataset of 200 responses will not ruin your analysis, but large gaps will. Decide early whether you are excluding cases with missing data or replacing them with an average, and be ready to justify that choice in your methodology chapter.
It is also worth running a quick scatterplot between your key variables before running the full regression. Graphs, then Chart Builder, then choose Scatter. This gives you a rough visual sense of whether a relationship even exists before you commit to the analysis.
Running the Regression
Once your data is clean, running the actual test takes about thirty seconds.
Go to Analyze, then Regression, then Linear. A dialog box will open asking you to sort your variables into two boxes.
Move your outcome variable, exam score in our example, into the box labelled Dependent. Move your predictor variables, study hours and any others, into the box labelled Independent(s).
Click the Statistics button and tick the boxes for Estimates, Confidence Intervals, and Model Fit. These give you the coefficients, their reliability, and an overall summary of how well your model performs. If you plan on discussing assumptions in your methodology, also tick Durbin-Watson and Collinearity Diagnostics while you are in this menu, since supervisors often expect to see these checked.
Click Continue, then click OK. SPSS will generate several tables in the output window. This is where most beginners freeze up, so let us go through exactly what to look at.
Reading the Output Without Losing Your Mind
The output window will show you four or five tables. You do not need to understand every number on the page, just the ones that answer your research question.
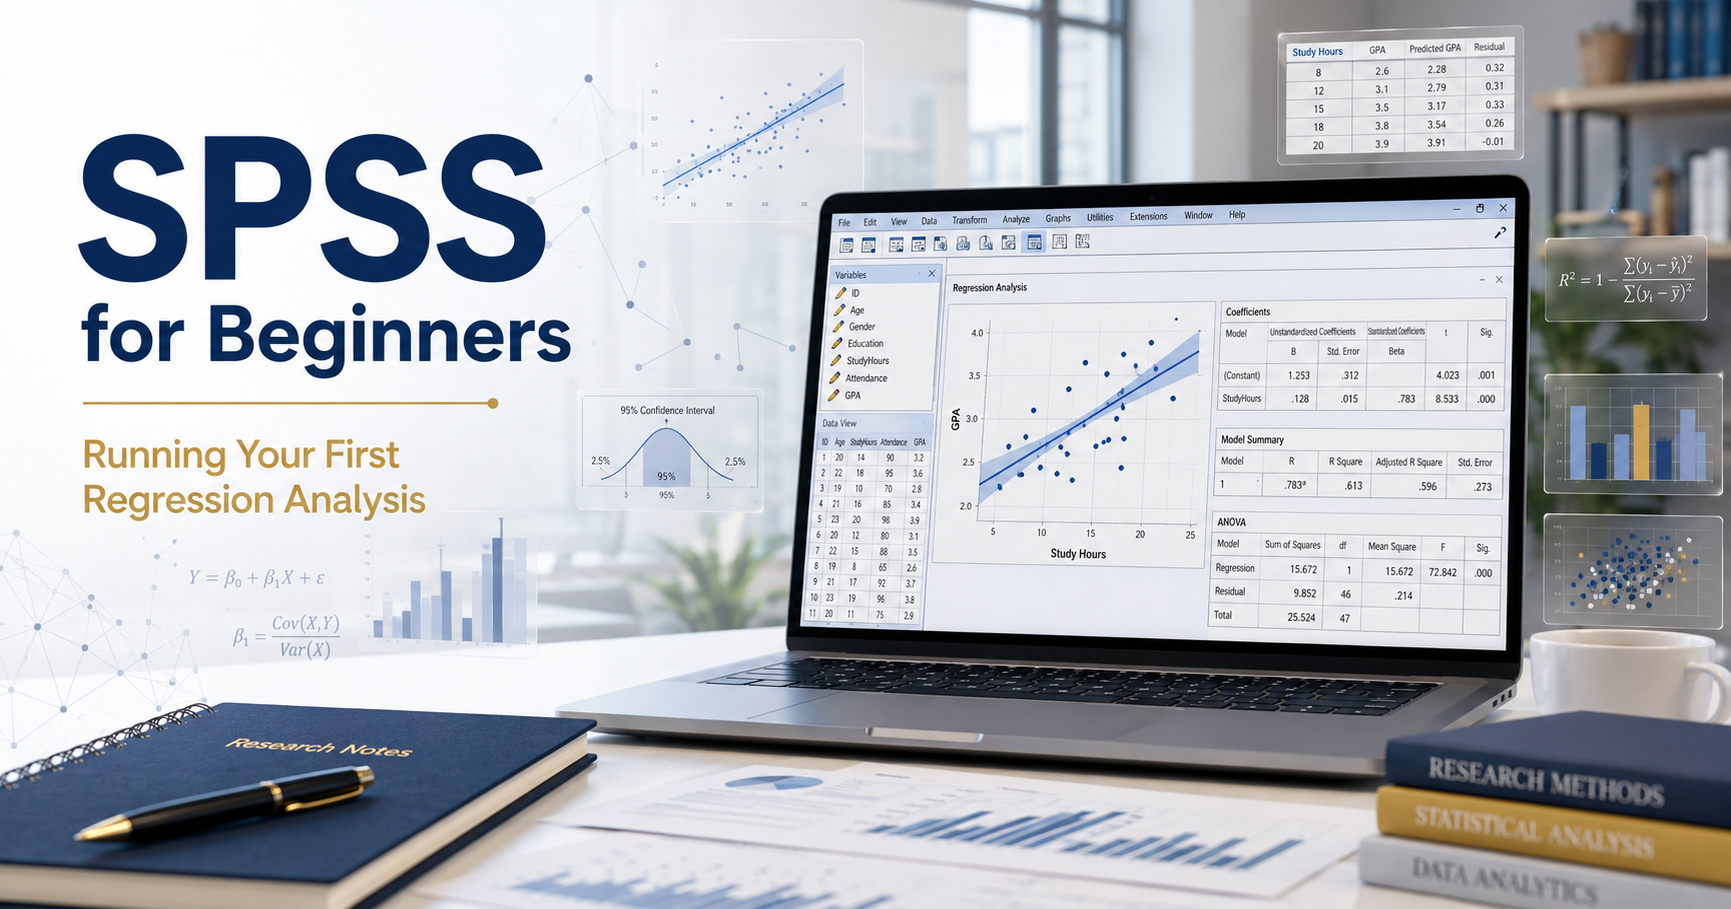
Model Summary table. Look for R Square. This tells you what percentage of the variation in your dependent variable is explained by your independent variables. An R Square of 0.35 means your predictors account for 35 percent of the change in exam scores, with the remaining 65 percent coming from other factors you have not measured. In social science research, an R Square between 0.10 and 0.50 is generally considered reasonable, so do not expect or need a number close to 1.
ANOVA table. Check the Sig. value, sometimes written as p. If this number is below 0.05, your overall model is statistically significant, meaning the relationship you found is unlikely to be down to random chance. If it is above 0.05, your model as a whole is not telling you anything reliable, and that is worth discussing honestly in your findings rather than hiding.
Coefficients table. This is the heart of your analysis. Each independent variable gets its own row. The B value shows the direction and size of the effect, for instance a B of 2.4 for study hours means each additional hour of study is associated with a 2.4 point increase in exam score, holding other variables constant. Again check the Sig. column for each variable individually. A variable with a significance value under 0.05 is a meaningful predictor. One above 0.05 is not pulling its weight in your model, even if it looked promising in your literature review.
Common Mistakes First Timers Make
A few errors show up again and again in undergraduate and masters dissertations, and knowing them in advance will save your supervisor a red pen.
Confusing correlation with causation is the big one. Regression can tell you that two things move together, it cannot prove that one causes the other. If your study design was not experimental, phrase your findings carefully, using language like "was associated with" rather than "caused."
Ignoring assumptions is another common slip. Linear regression assumes your residuals are roughly normally distributed and that there is no severe multicollinearity between your independent variables. Skipping these checks and going straight to your results section is a shortcut that examiners notice quickly. Running the Durbin-Watson and VIF checks mentioned earlier takes a few extra minutes and adds real credibility to your methodology chapter.
Overloading the model with too many independent variables is a trap many students fall into because it feels like more variables means a stronger dissertation. In reality, cramming in ten predictors with a sample size of 60 respondents will produce unstable, unreliable results. A rough rule of thumb taught in most UK research methods courses is at least ten to fifteen respondents per independent variable.
Finally, reporting only the numbers without interpreting them is a missed opportunity. A results section that lists B values and significance levels without explaining what they mean for your research question reads like a printout, not an argument. Always link the statistics back to your original hypothesis.
Writing Up Your Results
Once you have your output, translate it into plain academic English rather than pasting SPSS tables straight into your dissertation. A typical sentence might read: "A simple linear regression was conducted to examine whether study hours predicted exam performance. The model was statistically significant, F(1, 148) = 24.6, p < .001, and explained 34 percent of the variance in exam scores (R² = .34). Study hours significantly predicted exam scores (B = 2.4, p < .001), indicating that each additional hour of study was associated with a 2.4 point increase in exam performance."
That single paragraph tells your reader everything they need without forcing them to interpret raw output themselves, which is exactly what your marker is looking for.
Final Thoughts
Regression analysis looks far scarier from the outside than it actually is once you have run it a couple of times. The software does the maths, your job is understanding what question you are asking, preparing your data properly, and interpreting the output with care. Start with a simple model, get comfortable reading the tables, and only add complexity once the basics feel automatic.
If you are working through your data analysis chapter and want a second pair of eyes on your SPSS output or your write up, it is always worth having someone with research methods experience check your interpretation before submission. A misread significance value or an unchecked assumption is a small mistake that can cost real marks.


Comments (0)
Leave a Comment